Key financial information
(diese Seite ist nur auf Englisch oder Niederländisch verfügbar)
Consolidated Financial Statements
(in 000 EUR)
| 31/12/2025 9 months | 31/03/2025 | 31/03/2024 12 months | 31/03/2023 12 months | 31/03/2022 12 months | 31/03/2021 12 months | |
|---|---|---|---|---|---|---|
| Equity | 2 029 483 | 1 906 773 | 1 489 288 | 1 312 409 | 1 413 034 | 1 274 280 |
| Portfolio | 212 0943 | 1 623 346 | 1 558 979 | 1 522 898 | 1 448 547 | 1 232 929 |
| Cash and cash equivalents | 323 733 | 668 824 | 346 835 | 194 416 | 377 828 | 517 480 |
| Balance sheet total | 2 464 718 | 2 365 042 | 1 917 226 | 1 728 549 | 1 840 594 | 1 762 984 |
| Net profit | 173 312 | 219 001 | 217 129 | -59 467 | 174 285 | 205 724 |
| Total gross dividend *1 | 71 781 | 72.467 | 70 774 | 69 302 | 65 073 | 63 567 |
| Investments (own balance sheet) | 466 444 | 336 068 | 115 823 | 260 649 | 193 830 | 211 129 |
| Divestments (own balance sheet) | 196 457 | 559 982 | 364 644 | 175 037 | 218 920 | 265 510 |
| Number of employees | 95 | 94 | 93 | 93 | 90 | 89 |
Key figures per share
| 31/12/2025 9 months | 31/03/2025 | 31/03/2024 12 months | 31/03/2023 12 months | 31/03/2022 12 months | 31/03/2021 12 months | |
|---|---|---|---|---|---|---|
| Equity | 55.1 | 53.3 | 53.4 | 48.2 | 53.0 | 49.0 |
| Net profit | 4.8 | 7.47 | 7.79 | -2.20 | 6.59 | 7.96 |
| Gross dividend | 1.95* | 2.6 | 2.60 | 2.60 | 2.50 | 2.50 |
| Share price (on the closing date of the financial year) | 44.65 | 39.4 | 44.50 | 44.50 | 54.60 | 51.00 |
| Total numbers of shares | 36 810 933 | 35 767 300 | 27 872 041 | 27 220 734 | 26 654 508 | 25 841 318 |
*pro rata dividend
Financial ratios
| 31/12/2025 9 months | 31/03/2025 | 31/03/2024 12 months | 31/03/2023 12 months | 31/03/2022 12 months | 31/03/2021 12 months | |
|---|---|---|---|---|---|---|
| Pay-out ratio | 41.4% | 33.1% | 32.6% | n/a | 37.4% | 30.9% |
| Net return on equity | 9% | 14.7% | 16.5% | -4.2% | 13.7% | 18.6% |
| Gross return on portfolio *1 | 14.3%** | 19.3% | 19.1% | -0.1% | 20.4% | 27.0% |
| Premium (+) / discount (-) on equity | 19.0% | -26.1% | -16.7% | -7.7% | 3.0% | 4.1% |
*1 Realised capital gains + unrealised capital gains on financial fixed assets + dividends + interests / portfolio at start of financial year
**annualised 19.1%
Comments for the reader: the decimal character is a full stop; thousands are separated by a space.
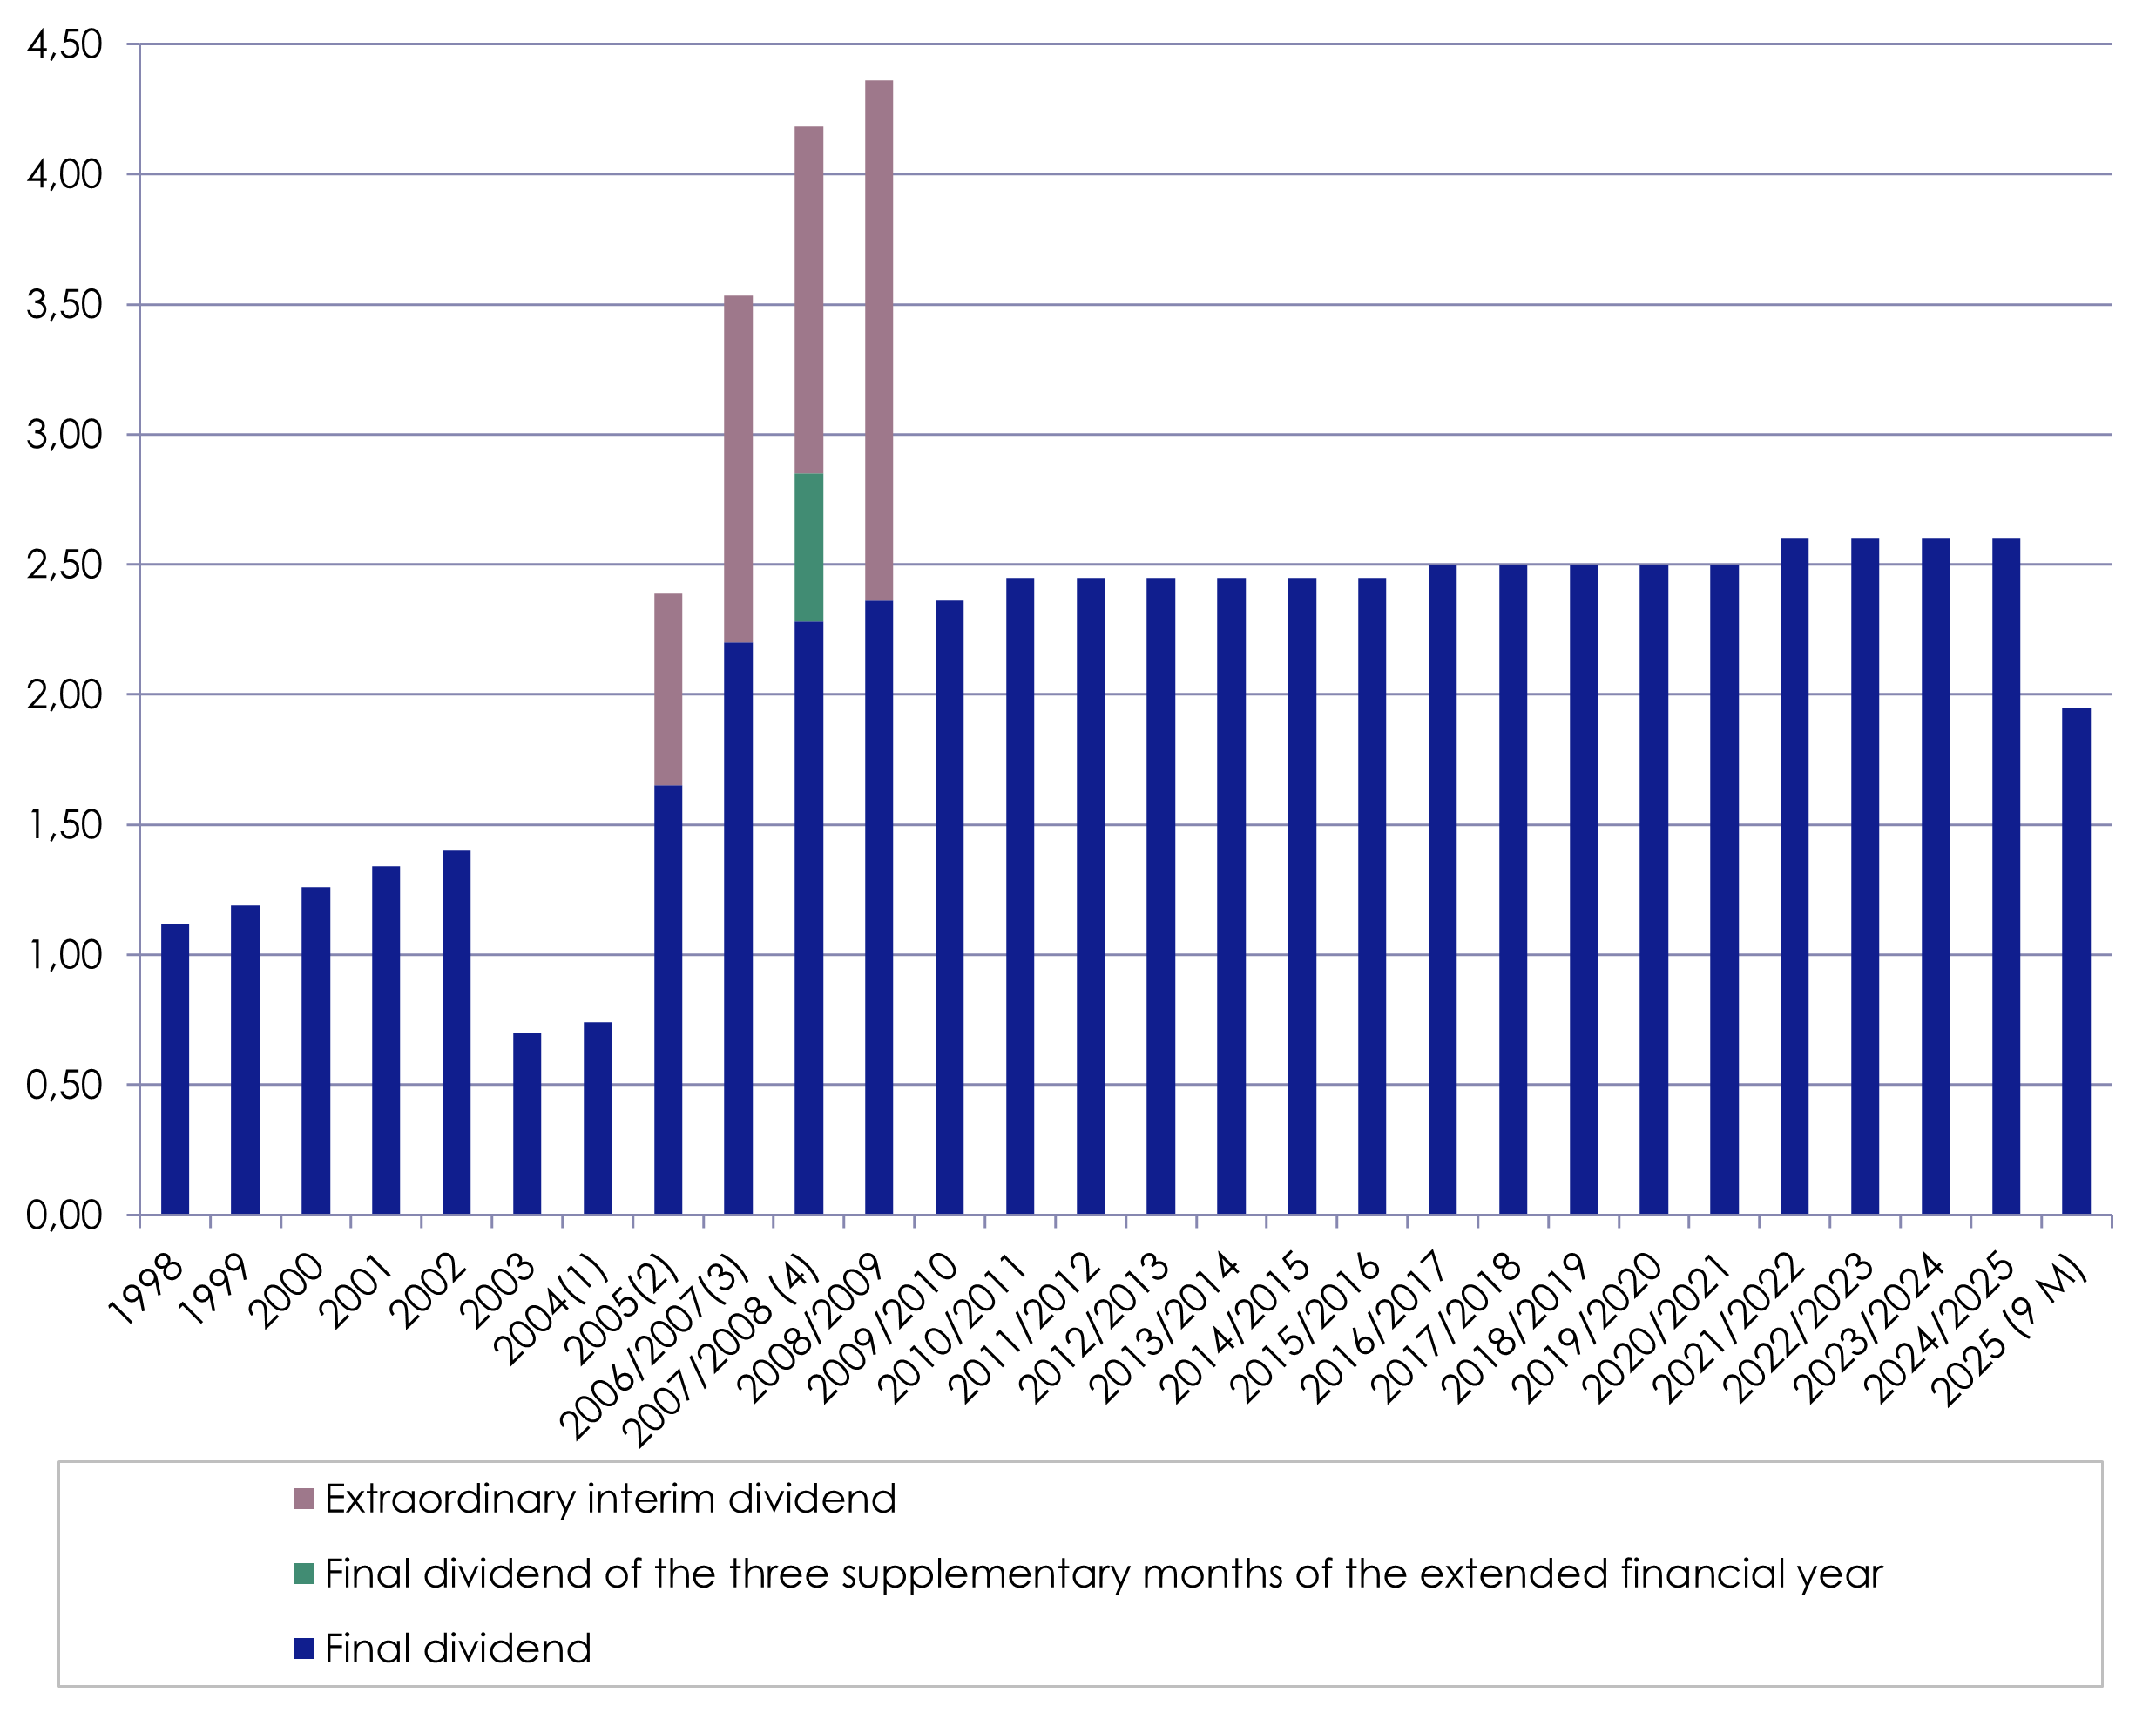
Dividend
The General Meeting of 27 May 2026 has decided to distribute a gross dividend of EUR 1.95 per share (net EUR 1.365 per share – calculated based on a gross dividend of EUR 2.60 per share, pro rata for the shortened 9-month financial year) in the form of a cash dividend for financial year 2025.
This evolution is consistent with Gimv's dividend policy of not lowering the dividend, except in exceptional circumstances, and to increase it whenever sustainably possible.
Optional dividend 2025
On 25-06-2025 the GM accepted the proposal from the Gimv’s Board of Directors to pay a gross dividend of EUR 2.60 (EUR 1.82 net) per share for the 2024-2025 financial year in the form of an optional dividend. As from 2 July 2025, shareholders will have the option to contribute their dividend to Gimv’s capital.
- Outcome of the optional dividend for the financial year 2024-2025 (press release NL/FR/EN)
- Modalities of the optional dividend for the financial year 2024-2025 (press release NL/FR)
- Information note optional dividend 2024-2025 (NL/FR)
- Statutory auditor's report on the optional dividend (NL)
- Gimv special report of the board of directors - in-kind contribution (optional dividend) (NL)
Dividend history
Download Gimv dividend history
| Financial year | Coupon number | Gross dividend | Ex-coupon | Record date | Payment date |
|---|---|---|---|---|---|
| 2025 (9 months) | 34 | 1.95 | 01/06/2026 | 02/06/2026 | 03/06/2026 |
| 2024-2025 | 33 | 2.60 | 30/06/2025 | 01/07/2025 | 25/07/2025 |
| 2023-2024 | 31 | 2.60 | 01/07/2024 | 02/07/2024 | 26/07/2024 |
| 2022-2023 | 30 | 2.60 | 03/07/2023 | 04/07/2023 | 28/07/2023 |
| 2021-2022 | 29 | 2.60 | 04/07/2022 | 05/07/2022 | 28/07/2022 |
| 2020-2021 | 28 | 2.50 | 05/07/2021 | 06/07/2021 | 30/07/2021 |
| 2019-2020 | 27 | 2.50 | 29/06/2020 | 30/06/2020 | 28/07/2020 |
| 2018-2019 | 26 | 2.50 | 01/07/2019 | 02/07/2019 | 03/07/2019 |
| 2017-2018 | 25 | 2.50 | 02/07/2018 | 03/07/2018 | 04/07/2018 |
| 2016-2017 | 24 | 2.50 | 03/07/2017 | 04/07/2017 | 05/07/2017 |
| 2015-2016 | 23 | 2.45 | 03/07/2016 | 04/07/2016 | 06/07/2016 |
| 2014-2015 | 22 | 2.45 | 29/06/2015 | 30/06/2015 | 01/07/2015 |
| 2013-2014 | 21 | 2.45 | 27/06/2014 | 01/07/2014 | 01/08/2014 |
| 2012-2013 | 20 | 2.45 | 28/06/2013 | 02/07/2013 | 02/08/2013 |
| 2011-2012 | 19 | 2.45 | 29/06/2012 | 03/07/2012 | 03/08/2012 |
| 2010-2011 | 18 | 2.45 | 04/07/2011 | 06/07/2011 | 07/07/2011 |
| 2009-2010 | 17 | 2.40 | 05/07/2010 | 07/07/2010 | 08/07/2010 |
| 2008-2009 | 16 | 2.36 | 26/06/2009 | 30/06/2009 | 01/07/2009 |
| 2007-2008 | 15 | 2.36 | 27/06/2008 | 30/06/2008 | 03/07/2008 |
| 2006-2007 | 14 | 2.00 | 06/12/2007 | ||
| 2006-2007 | 13 | 2.85 | 02/07/2007 | ||
| 2005-2006 | 12 | 1.33 | 06/12/2006 | ||
| 2005-2006 | 11 | 2.20 | 06/06/2006 | ||
| 2004-2005 | 10 | 1.33 | 15/11/2005 | ||
| 2004-2005 | 9 | 1.65 | 31/05/2005 | ||
| 2003-2004 | 8 | 0.74 | 29/10/2004 | ||
| 2003-2004 | 7 | 0.74 | 01/06/2004 | ||
| 2002-2003 | 6 | 0.70 | 03/06/2003 | ||
| 2001-2002 | 5 | 1.40 | 31/05/2002 | ||
| 2000-2001 | 4 | 1.34 | 01/06/2001 | ||
| 1999-2000 | 3 | 1.26 | 13/06/2000 | ||
| 1998-1999 | 2 | 1.19 | 11/06/1999 | ||
| 1997-1998 | 1 | 1.12 | 11/06/1998 |